How to Calculate Pixels per Foot for Video Analytics
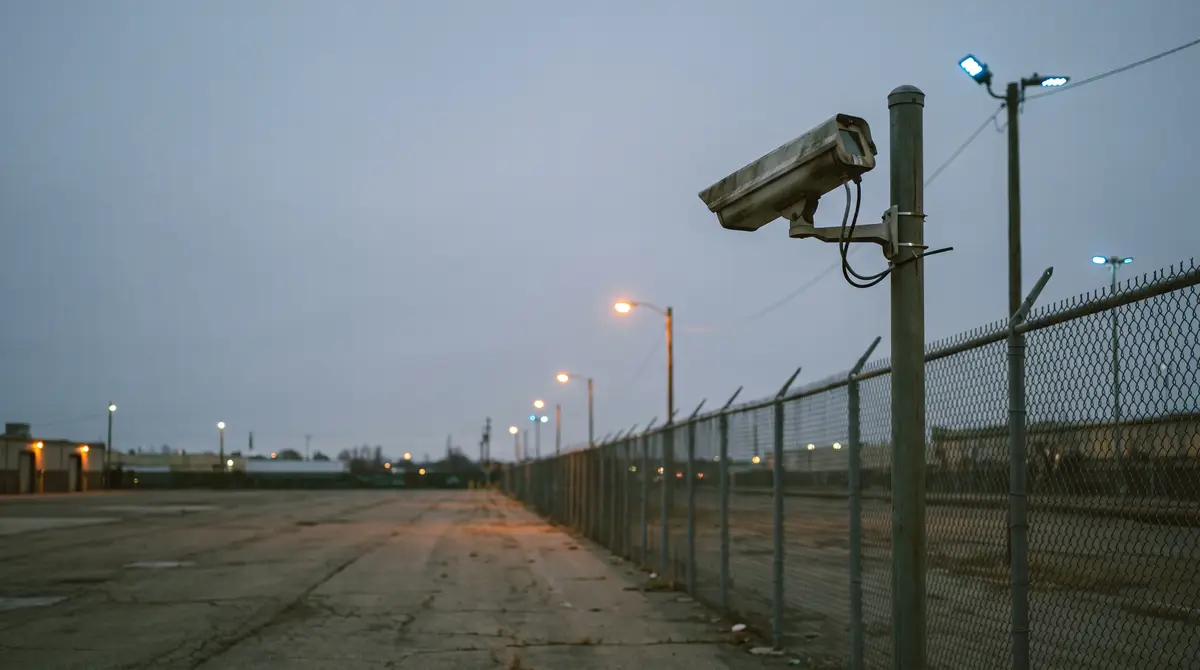
At 150 feet, a 1080p camera with a 90° field of view delivers 6.4 pixels per foot. A person standing there is 36 pixels tall, 3.3% of the frame, under the 4% Axis sets for its own person detection. Pull the zone in to 75 feet and the same camera clears it, with no new hardware.
The check takes two numbers per camera: pixels per foot at the far edge of the zone, and the person’s share of the frame. Both come from a datasheet and a spreadsheet, so a whole camera list can be sorted on paper before anyone schedules a pilot.
Pixels per foot counts the pixels that land on the target
Pixels per foot (px/ft) is the number of horizontal image pixels that cover one foot of the scene at a stated distance from the camera. It equals the image’s horizontal pixel count divided by the width of the scene at that distance. IEC 62676-4, the international application standard for video surveillance, uses pixels per meter. One px/ft is 3.28 px/m.
Two lines of arithmetic produce it:
- Scene width = 2 × distance × tan(horizontal field of view ÷ 2)
- Pixels per foot = horizontal pixels ÷ scene width
Three consequences follow, and each one surprises people who buy cameras by the megapixel. Double the distance and pixels per foot halves. Narrow the field of view and it rises, at the cost of coverage. Move from 1080p to 4K and the pixel count quadruples, but pixels per foot only doubles, because only the width counts.
The IEC 62676-4 ladder in pixels per foot
The 2025 edition of IEC 62676-4, published on October 9, 2025, anchors operational tasks to pixel density on the target plane. It replaced the four levels of the 2014 edition with seven. Axis Communications publishes the values in its white paper on the 2025 edition, dated September 2026. The pixels-per-foot column below is a straight conversion.
| Level (IEC 62676-4:2025) | Pixels per meter | Pixels per foot |
|---|---|---|
| Overview | 20 | 6.1 |
| Outline | 40 | 12.2 |
| Discern | 80 | 24.4 |
| Perceive | 125 | 38.1 |
| Characterize | 250 | 76.2 |
| Validate | 500 | 152.4 |
| Scrutinize | 1500 | 457.2 |
The 2014 levels, known as DORI, are still in circulation: Detect at 25 px/m, Observe at 63, Recognize at 125 and Identify at 250, or about 8, 19, 38 and 76 px/ft. Axis’s paper on the 2014 edition says new Axis datasheets still quote DORI distances. Its site-planning tool, AXIS Site Designer, still presets the 2014 levels, and 2025 values have to be entered by hand, according to the 2025 paper.
Axis is explicit about the ladder’s scope. The values assume a human operator interpreting the image, and for video analytics, the paper says, “other definitions apply.” Axis adds that light direction, lens quality and compression all move the result, and that meeting the model guarantees nothing. So the ladder gives installers, integrators and IT a shared vocabulary for a view. It doesn’t say what a model will detect in it.
The article on what PPE detection can and cannot verify runs into the same limit for hard hats and vests.
What camera makers publish for their own analytics
Where the standard stops, the camera makers’ own analytics documentation picks up. Four of them publish a minimum size for a person, and no two use the same unit.
| Maker and document | How the minimum is stated | Minimum for a person |
|---|---|---|
| Axis, AXIS Object Analytics manual (updated September 2026) | Share of image height | 4% minimum, 8% recommended |
| Avigilon, analytics design guide (March 2022) | Share of image height; pixels on target at 2 MP | 5% on H5A and H5A PTZ cameras, 8–15% on dual-head, modular and corner models; 24–36 px/m (Avigilon gives 8–11 px/ft) |
| Hanwha, Wisenet AI white paper (May 2020) | Pixels across the object’s shorter side | 15 px minimum, 30 recommended |
| Bosch, IVA capabilities per device (October 2023) | Pixels at the analytics’ own processing resolution | Objects of 256 square pixels (for example 16 × 16) to detect; a person 96 px tall to read PPE attributes |
Each figure belongs to one product line and one year, so none of them is “the” analytics requirement. Don’t average them, and don’t convert them into one number. Use the one that matches the system you’re evaluating, in its own unit.
Two things change the survey. The first is the resolution the analytics actually processes. A share-of-frame minimum, like the one in the AXIS Object Analytics manual, doesn’t move when a stream is scaled down. A pixel-count minimum does.
Bosch’s IVA capabilities paper documents analytics that shrink the video before analyzing it, for example to 640 × 360, and PPE analytics that run at up to 1280 × 720. So the survey needs the resolution the analytics works on, which may be neither the camera’s rating nor the recording stream.
The second is the gap between finding a person and reading what they wear. Within each maker’s own figures, the gap is wide. Bosch detects an object of 16 × 16 pixels and needs a person 96 pixels tall to read PPE attributes. Hanwha’s 2020 paper asks for 15 pixels across a person to detect them, and at least 112 along the long side, 352 recommended, to read attributes. Detection is cheap in pixels, and attributes are expensive.
What to collect for each camera before you start
One row per camera. These eleven columns are the whole worksheet, lettered as they sit in a spreadsheet:
- A · Camera: the ID, the location and the mounting height.
- B · Detection and zone: what you want from this camera, and which part of its view that covers.
- C · Target distance: feet, to the far edge of the zone.
- D · Analyzed width: pixels, of the frame the analytics processes.
- E · Analyzed height: pixels, of the same frame.
- F · Field of view: horizontal degrees, measured, at the zoom set on site.
- G · Pixels per foot:
=D2/(2*C2*TAN(RADIANS(F2/2))) - H · Person share of frame:
=G2*5.58/E2, formatted as a percentage, for a person 5 ft 7 in (5.58 ft) tall. - I · Minimum to meet: the criterion of the system you’re evaluating, in its own unit.
- J · Night check: whether infrared is on, and whether the person is still distinct at the far edge.
- K · Decision: keep, re-zone or reassign.
Columns A to F are inputs, G and H are formulas, and I to K are the survey. People skip column J.
Six steps from a camera list to a decision
Step 1: Fix the target distance for each detection
Start from the detection, not the camera. For each camera, mark the farthest point where the detection has to work: the end of the fence run, the far edge of the gate apron, the back row of a parking lot. Record it in column C.
The common mistake is measuring to the center of the view. Detection fails at the far edge first, so the far edge is the number that matters.
Step 2: Use the measured field of view, not the focal length
Lens arithmetic gives a field of view from the sensor width and the focal length. Real lenses distort. In Hanwha’s white paper on lens specifications, published in October 2025, one 5 MP sensor with a 2.4 mm lens calculates to 95° and measures 123°. Using the calculated figure there would overstate pixels per foot by about 69%, averaged across the frame.
Take the measured horizontal field of view from the datasheet for column F. On a varifocal camera, record the zoom set on the pole, not the range printed on the box.
Step 3: Calculate the scene width and pixels per foot
Take the fence-line camera from the worked survey below: a 1920-pixel stream with a measured 90° field of view, 150 feet from the far edge of its zone. The scene there is 300 feet wide. That is 6.4 px/ft, or about 21 px/m, which lands at Overview on the 2025 ladder.
The mistake here is using the recording resolution when the analytics reads something smaller. Columns D and E hold the analyzed resolution, so ask for it.
Step 4: Convert pixels per foot into the person’s share of the frame
Most analytics minimums are written in terms of the object, so convert. With square pixels, density is the same vertically. A person 5 ft 7 in (1.7 m) tall, at 6.4 px/ft, is about 36 pixels tall. On a 1080-row frame, that is 3.3% of the image height.
Now compare it with column I, in that system’s own unit. Against Axis’s criterion, 3.3% misses the 4% minimum.
Step 5: Sort each camera into one of three decisions
- Keep: the target clears the minimum with room to spare, at the far edge.
- Re-zone: shorten the target distance. Narrow the zone to the part of the view that clears, change the zoom, or move the camera to a closer mount. Each of these is cheaper than a new camera.
- Reassign: the view supports finding a person but not reading what they wear. Run presence detections there, and give attribute detections to a closer camera.
The expensive mistake is replacing a camera whose only problem is where it points.
Step 6: Check the view after dark
The arithmetic assumes a lit, sharp target, and each maker sets its own light floor:
- Axis recommends at least 50 lux across the whole detection area for day-and-night cameras under artificial light.
- Hanwha’s 2020 paper suggests a minimum of 300 lux.
- Avigilon’s guide asks for 8 lux on the target.
Pull a recorded clip of the far edge after dark, from the stream the analytics reads, with someone walking the zone if you can arrange it. In column J, record whether infrared was on and whether the person was still distinct at the far edge. A camera that clears the pixel minimum at noon can still fail the light minimum at midnight.
A worked survey of four cameras at one site
Consider a monitoring desk adding analytics to one site it already watches: a fence line, a vehicle gate, a parking lot and a lobby. The desk wants presence detections here, such as intrusion and after-hours entry. The figures are illustrative. Each assumes a person 5 ft 7 in (1.7 m) tall, and is checked against Axis’s person criterion of 4% minimum and 8% recommended.
| Camera | Pixels per foot at the target | Person in the frame | Decision |
|---|---|---|---|
| Fence line: 1080p, 90° measured, 150 ft | 6.4 (21 px/m, Overview) | 36 px, 3.3% | Re-zone to 75 ft: 12.8 px/ft, 72 px, 6.6%. The next pole covers the far half. |
| Vehicle gate: 4 MP (2688 × 1520), 45°, 40 ft | 81.1 (266 px/m, Characterize) | 453 px, 30% | Keep. Read at 640 × 360, it drops to 19.3 px/ft, and the person still fills 30% of the frame. |
| Parking lot: 1080p, 110°, 120 ft | 5.6 (18 px/m, below Overview) | 31 px, 2.9% | Re-zone to 60 ft: 11.2 px/ft, 63 px, 5.8%. Hand the back rows to the next camera. |
| Lobby dome: 1080p, 100°, 25 ft | 32.2 (106 px/m, Discern) | 180 px, 16.7% | Keep. |
None of the four needs replacing, and two need a shorter zone. The fence line at 75 feet still sits under Axis’s recommended 8%, so it’s a candidate for tighter zoom once a second camera takes the far half. For that fence run, calibrating loitering detection on a fence line is the next decision after the pixels.
No row lands on reassign, because this desk wants presence detections only. A site that also wanted PPE at the gate would test the gate against that system’s attribute minimum, which is a far higher bar than detection.
The gate is the instructive row. Scaled down to a 640 × 360 frame, its pixels per foot falls fourfold, while the person’s share of the frame doesn’t move. Under a share-of-frame minimum the scaling costs nothing. Under a pixel-count minimum it can decide the outcome. That is why the worksheet records the analyzed resolution rather than the camera’s rating.
Surveying cameras for Nsightify’s zone detections
Nsightify works with existing IP cameras, with no camera replacement required, and the survey is how that holds camera by camera. The three decisions map directly onto how its detections are set up.
Zone detections are placed as a shape on each camera’s view. A camera marked re-zone gets its zone drawn over the part of the view that clears the minimum, and the far half goes to the next camera. A camera marked reassign runs presence detections, such as intrusion into a restricted zone or after-hours zone entry, and leaves attribute detections like PPE compliance to a closer view. The stream Nsightify analyzes is configurable per camera, so the worksheet’s analyzed-resolution columns hold a setting to choose per camera.
Views drift after a survey. Camera tampering, one of the ready-to-run detections, alerts when a camera has been repositioned, which is also when its zones need a second look.
The survey says whether a view can carry a detection. It can’t say how any model performs on it. That takes testing video analytics on your own cameras, on footage from the far edge, after dark. The worksheet also belongs in the network requirements packet IT approves, because it names the stream each camera will send.
Frequently asked questions
What is 40 pixels per foot resolution?
Forty pixels per foot means 40 horizontal image pixels cover each foot of the scene at the target distance, about 131 pixels per meter. On the IEC 62676-4:2025 ladder that sits just above Perceive, at 125 px/m. In the 2014 DORI terms, it clears Recognize. At that density a person 5 ft 7 in tall is about 223 pixels tall. Whether analytics detects them depends on that maker’s own minimum.
What does DORI mean for a camera?
DORI stands for Detect, Observe, Recognize and Identify, the four pixel-density levels in the 2014 edition of IEC 62676-4. They are 25, 63, 125 and 250 pixels per meter, or about 8, 19, 38 and 76 pixels per foot. The 2025 edition replaced them with seven levels, from Overview at 20 px/m to Scrutinize at 1500. Both editions assume a person is watching the image.
How do you calculate pixels per foot?
Divide the horizontal pixel count of the stream by the width of the scene at the target distance. Scene width is two times the distance times the tangent of half the horizontal field of view. A 1920-pixel stream with a 90° field of view covers 300 feet of width at 150 feet, so it delivers 6.4 pixels per foot there. Use the measured field of view from the datasheet.
Does a 4K camera give four times the pixels per foot of 1080p?
No. A 4K stream (3840 × 2160) has four times the pixels of 1080p (1920 × 1080), but only twice as many across its width. With the same lens at the same distance, pixels per foot doubles. Halving the distance to the target does the same thing at no hardware cost, which is why a survey often ends with a camera re-aimed rather than replaced.
A finished worksheet is the most useful thing to bring to a demo. It shows which cameras can carry which detections today, which need a shorter zone, and which were never pointed at the problem. Book an Nsightify demo and bring that list with you.
More on this from Nsightify: AI video analytics on existing IP and CCTV cameras.

See Nsightify in Action
We're onboarding a limited number of pilot partners. If you're an operations or security leader in construction, warehousing, or manufacturing — let's talk.